Identify replicated individuals
gl.report.replicates(
  x,
  loc_threshold = 100,
  perc_geno = 0.99,
  plot.out = TRUE,
  plot_theme = theme_dartR(),
  plot_colors = two_colors,
  bins = 100,
  verbose = NULL
)
Arguments
- x
Name of the genlight object containing the SNP data [required].
- loc_threshold
Minimum number of loci required to asses that two individuals are replicates [default 100].
- perc_geno
Mimimum percentage of genotypes in which two individuals should be the same [default 0.99].
- plot.out
Specify if plot is to be produced [default TRUE].
- plot_theme
User specified theme [default theme_dartR()].
- plot_colors
Vector with two color names for the borders and fill [default two_colors].
- bins
Number of bins to display in histograms [default 100].
- verbose
Verbosity: 0, silent or fatal errors; 1, begin and end; 2, progress log; 3, progress and results summary; 5, full report [default 2, unless specified using gl.set.verbosity].
Value
A list with three elements:
table.rep: A dataframe with pairwise results of percentage of same genotypes between two individuals, the number of loci used in the comparison and the missing data for each individual.
ind.list.drop: A vector of replicated individuals to be dropped. Replicated individual with the least missing data is reported.
ind.list.rep: A list of of each individual that has replicates in the dataset, the name of the replicates and the percentage of the same genotype.
Details
This function uses an C++ implementation, so package Rcpp needs to be installed and it is therefore fast (once it has compiled the function after the first run).
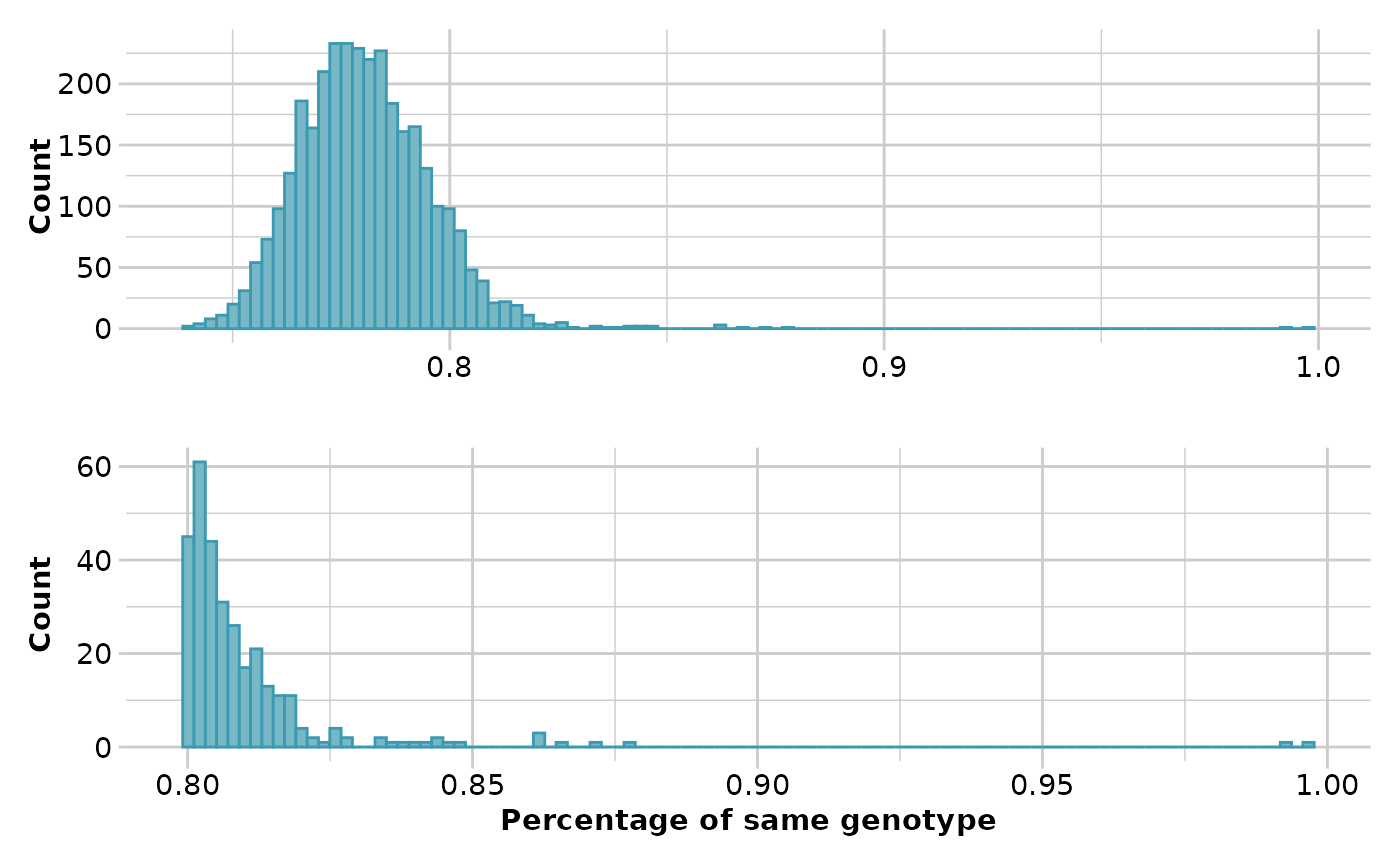
Ideally, in a large dataset with related and unrelated individuals and several replicated individuals, such as in a capture/mark/recapture study, the first histogram should have four "peaks". The first peak should represent unrelated individuals, the second peak should correspond to second-degree relationships (such as cousins), the third peak should represent first-degree relationships (like parent/offspring and full siblings), and the fourth peak should represent replicated individuals.
In order to ensure that replicated individuals are properly identified, it's important to have a clear separation between the third and fourth peaks in the second histogram. This means that there should be bins with zero counts between these two peaks.
See also
Other report functions:
gl.report.bases(),
gl.report.callrate(),
gl.report.diversity(),
gl.report.hamming(),
gl.report.hwe(),
gl.report.ld.map(),
gl.report.locmetric(),
gl.report.maf(),
gl.report.monomorphs(),
gl.report.overshoot(),
gl.report.pa(),
gl.report.parent.offspring(),
gl.report.rdepth(),
gl.report.reproducibility(),
gl.report.secondaries(),
gl.report.sexlinked(),
gl.report.taglength()
Examples
# \donttest{
res_rep <- gl.report.replicates(platypus.gl, loc_threshold = 500,
perc_geno = 0.85)
#> Starting gl.report.replicates
#>   Processing genlight object with SNP data
#>   Warning: data include loci that are scored NA across all individuals.
#>   Consider filtering using gl <- gl.filter.allna(gl)
#>

#> Completed: gl.report.replicates
#>
# }
#> Completed: gl.report.replicates
#>
# }