Reports summary of sequence tag length across loci
Source:R/gl.report.taglength.r
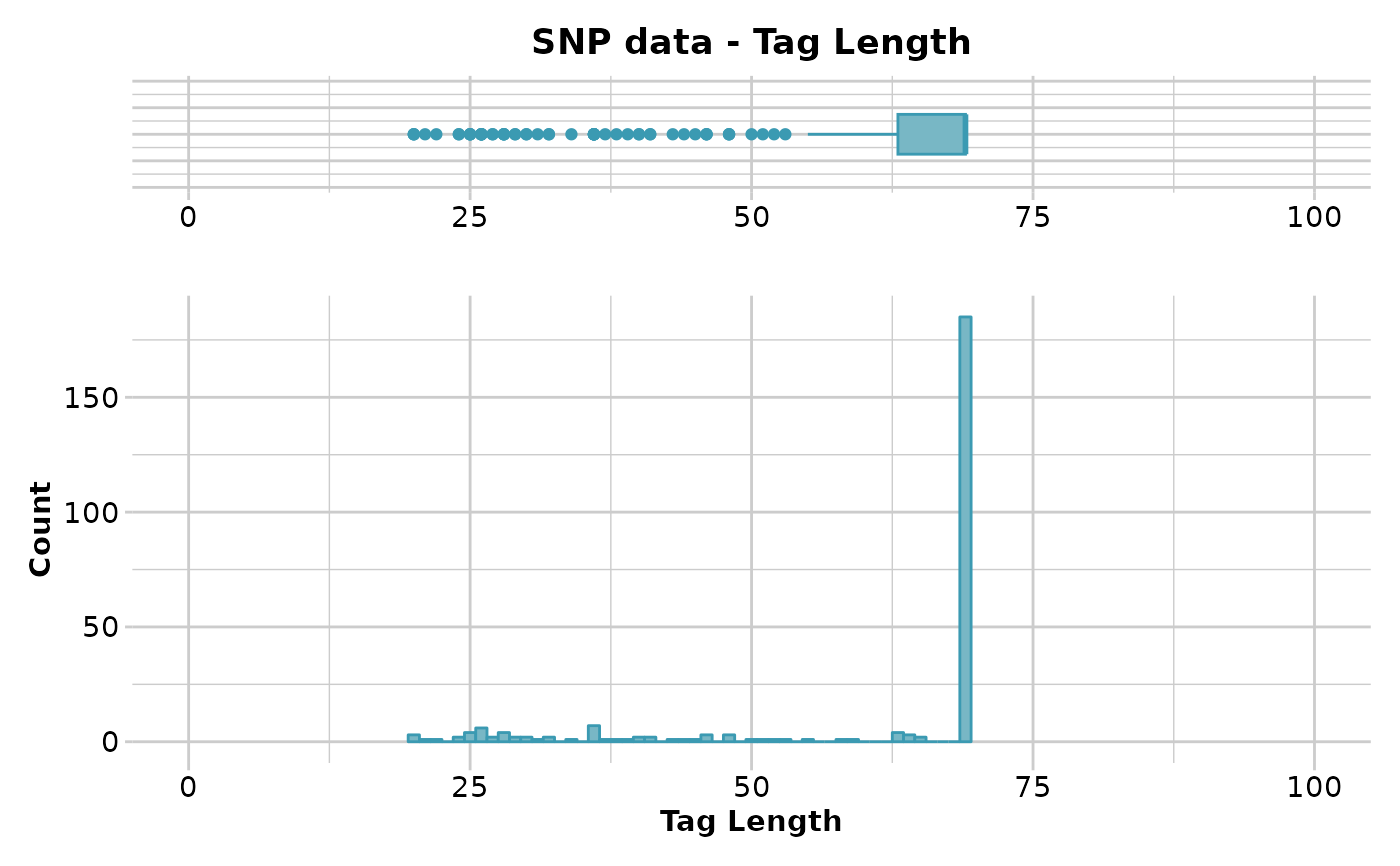
gl.report.taglength.RdSNP datasets generated by DArT typically have sequence tag lengths ranging from 20 to 69 base pairs. This function reports summary statistics of the tag lengths.
gl.report.taglength(
  x,
  plot.out = TRUE,
  plot_theme = theme_dartR(),
  plot_colors = two_colors,
  save2tmp = FALSE,
  verbose = NULL
)
Arguments
- x
Name of the genlight object containing the SNP [required].
- plot.out
If TRUE, displays a plot to guide the decision on a filter threshold [default TRUE].
- plot_theme
Theme for the plot. See Details for options [default theme_dartR()].
- plot_colors
List of two color names for the borders and fill of the plots [default two_colors].
- save2tmp
If TRUE, saves any ggplots and listings to the session temporary directory (tempdir) [default FALSE].
- verbose
Verbosity: 0, silent or fatal errors; 1, begin and end; 2, progress log; 3, progress and results summary; 5, full report [default 2, unless specified using gl.set.verbosity]
Value
Returns unaltered genlight object
Details
The function gl.filter.taglength will filter out the
loci with a tag length below a specified threshold.
Quantiles are partitions of a finite set of values into q subsets of (nearly) equal sizes. In this function q = 20. Quantiles are useful measures because they are less susceptible to long-tailed distributions and outliers.
Function's output
The minimum, maximum, mean and a tabulation of tag length quantiles against thresholds are provided. Output also includes a boxplot and a histogram to guide in the selection of a threshold for filtering on tag length.
Plots and table are saved to the temporal directory (tempdir) and can be
accessed with the function gl.print.reports and listed with
the function gl.list.reports. Note that they can be accessed
only in the current R session because tempdir is cleared each time that the
R session is closed.
Examples of other themes that can be used can be consulted in
See also
gl.filter.taglength, gl.list.reports,
gl.print.reports
Other report functions:
gl.report.bases(),
gl.report.callrate(),
gl.report.diversity(),
gl.report.hamming(),
gl.report.hwe(),
gl.report.ld.map(),
gl.report.locmetric(),
gl.report.maf(),
gl.report.monomorphs(),
gl.report.overshoot(),
gl.report.pa(),
gl.report.parent.offspring(),
gl.report.rdepth(),
gl.report.replicates(),
gl.report.reproducibility(),
gl.report.secondaries(),
gl.report.sexlinked()
Examples
out <- gl.report.taglength(testset.gl)
#> Starting gl.report.taglength
#>   Processing genlight object with SNP data
#>   Reporting Tag Length
#>   No. of loci = 255
#>   No. of individuals = 250
#>     Minimum      :  20
#>     1st quantile :  63
#>     Median       :  69
#>     Mean         :  60.70196
#>     3r quantile  :  69
#>     Maximum      :  69
#>     Missing Rate Overall:  0.12
#>

#>    Quantile Threshold Retained Percent Filtered Percent
#> 1      100%        69      185    72.5       70    27.5
#> 2       95%        69      185    72.5       70    27.5
#> 3       90%        69      185    72.5       70    27.5
#> 4       85%        69      185    72.5       70    27.5
#> 5       80%        69      185    72.5       70    27.5
#> 6       75%        69      185    72.5       70    27.5
#> 7       70%        69      185    72.5       70    27.5
#> 8       65%        69      185    72.5       70    27.5
#> 9       60%        69      185    72.5       70    27.5
#> 10      55%        69      185    72.5       70    27.5
#> 11      50%        69      185    72.5       70    27.5
#> 12      45%        69      185    72.5       70    27.5
#> 13      40%        69      185    72.5       70    27.5
#> 14      35%        69      185    72.5       70    27.5
#> 15      30%        69      185    72.5       70    27.5
#> 16      25%        63      194    76.1       61    23.9
#> 17      20%        46      207    81.2       48    18.8
#> 18      15%        37      217    85.1       38    14.9
#> 19      10%        30      230    90.2       25     9.8
#> 20       5%        26      244    95.7       11     4.3
#> 21       0%        20      255   100.0        0     0.0
#> Completed: gl.report.taglength
#>
#> Quantile Threshold Retained Percent Filtered Percent
#> 1 100% 69 185 72.5 70 27.5
#> 2 95% 69 185 72.5 70 27.5
#> 3 90% 69 185 72.5 70 27.5
#> 4 85% 69 185 72.5 70 27.5
#> 5 80% 69 185 72.5 70 27.5
#> 6 75% 69 185 72.5 70 27.5
#> 7 70% 69 185 72.5 70 27.5
#> 8 65% 69 185 72.5 70 27.5
#> 9 60% 69 185 72.5 70 27.5
#> 10 55% 69 185 72.5 70 27.5
#> 11 50% 69 185 72.5 70 27.5
#> 12 45% 69 185 72.5 70 27.5
#> 13 40% 69 185 72.5 70 27.5
#> 14 35% 69 185 72.5 70 27.5
#> 15 30% 69 185 72.5 70 27.5
#> 16 25% 63 194 76.1 61 23.9
#> 17 20% 46 207 81.2 48 18.8
#> 18 15% 37 217 85.1 38 14.9
#> 19 10% 30 230 90.2 25 9.8
#> 20 5% 26 244 95.7 11 4.3
#> 21 0% 20 255 100.0 0 0.0
#> Completed: gl.report.taglength
#>