library(dartRverse)
library(hierfstat)6 Management of Small Populations
Session Presenters

Written by Kate Farquharson with input from Catherine Grueber.
Required packages
make sure you have the packages installed, see Install dartRverse
Load data and explore
The data is a subset of the genome-wide SNPs that are publicly available from the following study, Farquharson et al. (2022).
The study aims were to investigate:
- The current genetic diversity of Tasmanian devils across their entire range
- Whether the genetic diversity of the insurance population is representative of the species
Questions
- How many SNPs are there?
- How many individuals are in the dataset?
- What is the distribution of individuals in populations?
load("./data/session6_gl.Rdata")
gl
/// GENLIGHT OBJECT /////////
// 300 genotypes, 1,663 binary SNPs, size: 1 Mb
35182 (7.05 %) missing data
// Basic content
@gen: list of 300 SNPbin
@ploidy: ploidy of each individual (range: 2-2)
// Optional content
@ind.names: 300 individual labels
@loc.names: 1663 locus labels
@loc.all: 1663 alleles
@pop: population of each individual (group size range: 20-20)
@other: a list containing: loc.metrics loc.metrics.flags verbose history ind.metrics summary(gl@pop) Bronte Buckland Fentonbury ForestierMurdunna
20 20 20 20
GranvilleHarbour IP Kempton MariaIsland
20 20 20 20
Narawntapu RobbinsIsland SilverPlains StonyHead
20 20 20 20
TasmanPeninsula Woolnorth wukalina
20 20 20 Allocate colours to populations
Allocate colours based on site location: East / Central / West Tasmania and captive breeding program.
levels(gl@pop) [1] "Bronte" "Buckland" "Fentonbury"
[4] "ForestierMurdunna" "GranvilleHarbour" "IP"
[7] "Kempton" "MariaIsland" "Narawntapu"
[10] "RobbinsIsland" "SilverPlains" "StonyHead"
[13] "TasmanPeninsula" "Woolnorth" "wukalina" #west = yellow; central = blue; east = green; insurance population/Maria Island = orange
tascols <- c("skyblue", "#74c476", "skyblue", "#74c476", "#FDD835", "orange", "skyblue",
"orange", "skyblue", "#FDD835", "skyblue", "#74c476", "#74c476", "#FDD835",
"#74c476")Report minor allele frequency (MAF)
Questions
- Do you notice any patterns in minor allele frequency?
- Are there differences between the overall MAF distribution and that of individual populations?
gl.report.maf(gl)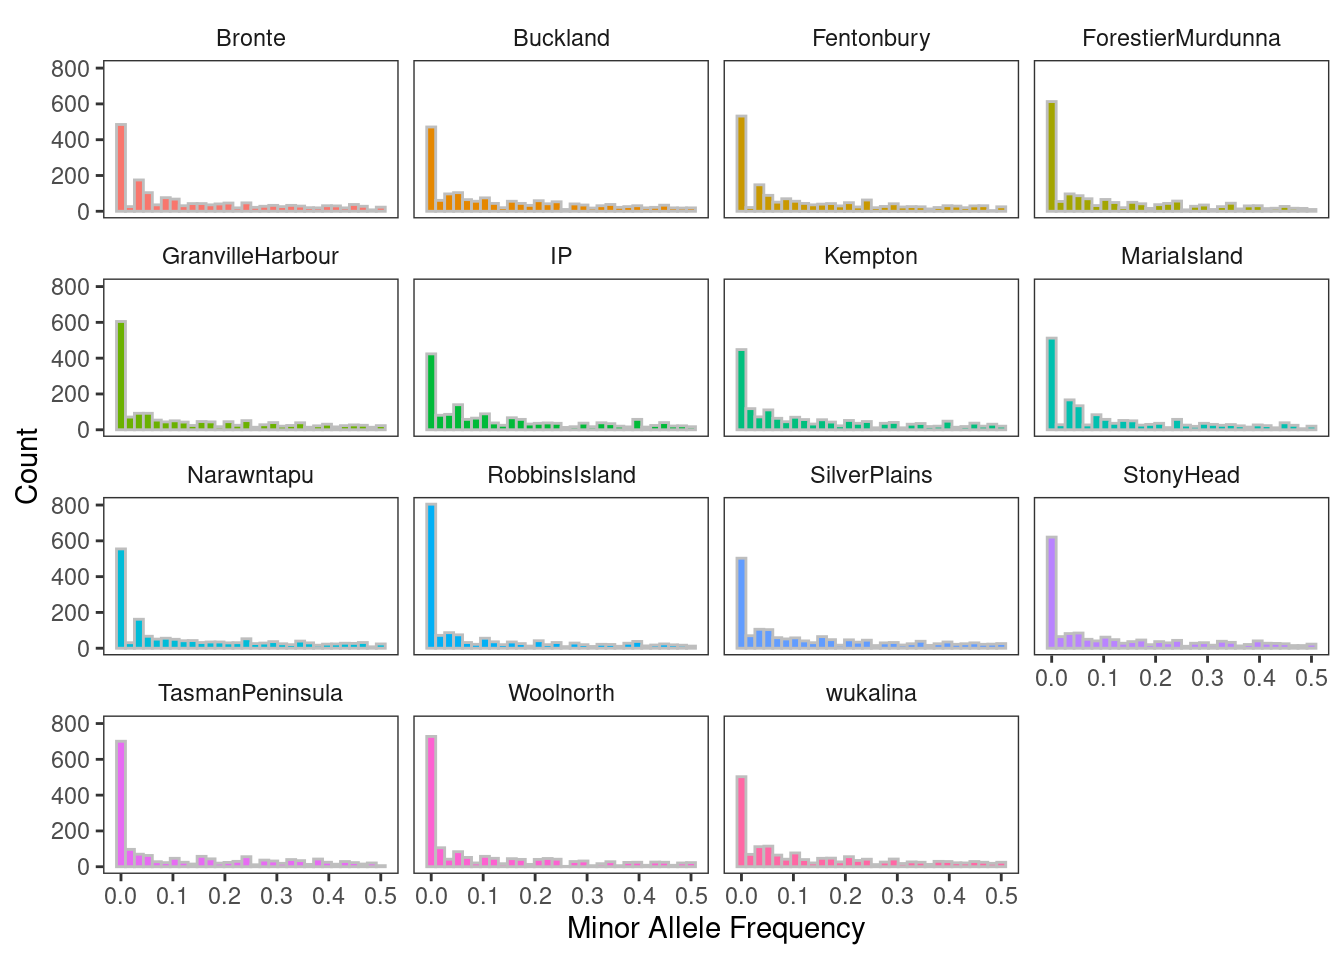
Visualise population structure by PCoA
Run the PCoA, with points shaded by locations.
Questions
- How would you describe any patterns in population structure?
- How does the population structure of the insurance population (orange) compare to that of the wild?
pcoa <- gl.pcoa(gl)Starting gl.pcoa
Processing genlight object with SNP data
Performing a PCA, individuals as entities, loci as attributes, SNP genotype as state
Starting gl.colors
Selected color type 2
Completed: gl.colors 
Completed: gl.pcoa gl.pcoa.plot(pcoa, gl)Starting gl.pcoa.plot
Processing an ordination file (glPca)
Processing genlight object with SNP data
Package directlabels needed for this function to work. Please install it.[1] -1#visualise PCoA using the colour groupings of east/central/west/insurance population
gl.pcoa.plot(pcoa, gl, pt.colors=tascols)Starting gl.pcoa.plot
Processing an ordination file (glPca)
Processing genlight object with SNP data
Package directlabels needed for this function to work. Please install it.[1] -1Calculate allelic richness for each population
This calculation requires the hierfstat package, so make sure the hierfstat is loaded using the library function.
#convert the genlight object to genind format
gi <- gl2gi(gl)
Starting gl2gi
Processing genlight object with SNP data
Matrix converted.. Prepare genind object...
Completed: gl2gi #convert genind object to hierfstat format
hfstat <- genind2hierfstat(gi)
#calculate allelic richness
ar <- allelic.richness(hfstat)
names(ar)[1] "min.all" "Ar" ar$min.all # rarefied to 12, the smallest sample size for a genotyped locus[1] 12summary(ar$Ar) #gives mean AR for each population Bronte Buckland Fentonbury ForestierMurdunna
Min. :1.000 Min. :1.000 Min. :1.000 Min. :1.000
1st Qu.:1.000 1st Qu.:1.000 1st Qu.:1.000 1st Qu.:1.000
Median :1.692 Median :1.717 Median :1.692 Median :1.538
Mean :1.558 Mean :1.578 Mean :1.549 Mean :1.506
3rd Qu.:1.982 3rd Qu.:1.985 3rd Qu.:1.983 3rd Qu.:1.975
Max. :2.000 Max. :2.000 Max. :2.000 Max. :2.000
GranvilleHarbour IP Kempton MariaIsland
Min. :1.000 Min. :1.000 Min. :1.000 Min. :1.000
1st Qu.:1.000 1st Qu.:1.000 1st Qu.:1.000 1st Qu.:1.000
Median :1.538 Median :1.717 Median :1.692 Median :1.588
Mean :1.508 Mean :1.588 Mean :1.575 Mean :1.537
3rd Qu.:1.977 3rd Qu.:1.981 3rd Qu.:1.985 3rd Qu.:1.975
Max. :2.000 Max. :2.000 Max. :2.000 Max. :2.000
Narawntapu RobbinsIsland SilverPlains StonyHead
Min. :1.000 Min. :1.000 Min. :1.000 Min. :1.000
1st Qu.:1.000 1st Qu.:1.000 1st Qu.:1.000 1st Qu.:1.000
Median :1.648 Median :1.300 Median :1.668 Median :1.562
Mean :1.535 Mean :1.402 Mean :1.555 Mean :1.505
3rd Qu.:1.986 3rd Qu.:1.936 3rd Qu.:1.984 3rd Qu.:1.977
Max. :2.000 Max. :2.000 Max. :2.000 Max. :2.000
TasmanPeninsula Woolnorth wukalina
Min. :1.000 Min. :1.000 Min. :1.000
1st Qu.:1.000 1st Qu.:1.000 1st Qu.:1.000
Median :1.316 Median :1.300 Median :1.668
Mean :1.466 Mean :1.443 Mean :1.550
3rd Qu.:1.981 3rd Qu.:1.948 3rd Qu.:1.976
Max. :2.000 Max. :2.000 Max. :2.000 ar <- as.data.frame(ar$Ar)
mean.ar <- colMeans(ar)Calculate a measure of variance for allelic richness, e.g. standard error. Standard error = standard deviation / sqrt(n), where n is the number of genotyped loci
sd(ar$Bronte, na.rm=TRUE)/sqrt(nrow(ar) - length(which(is.na(ar$Bronte))))[1] 0.01017173Boxplot of allelic richness per population:
Questions
- Which populations have the highest and the lowest allelic richness?
- Can you think of any explanation?
#first, extend the margins of the graphing window to fit long axis labels
par(mar=c(8,3,3,3))
boxplot(ar, ylab="Allelic richness", las=2, col=tascols)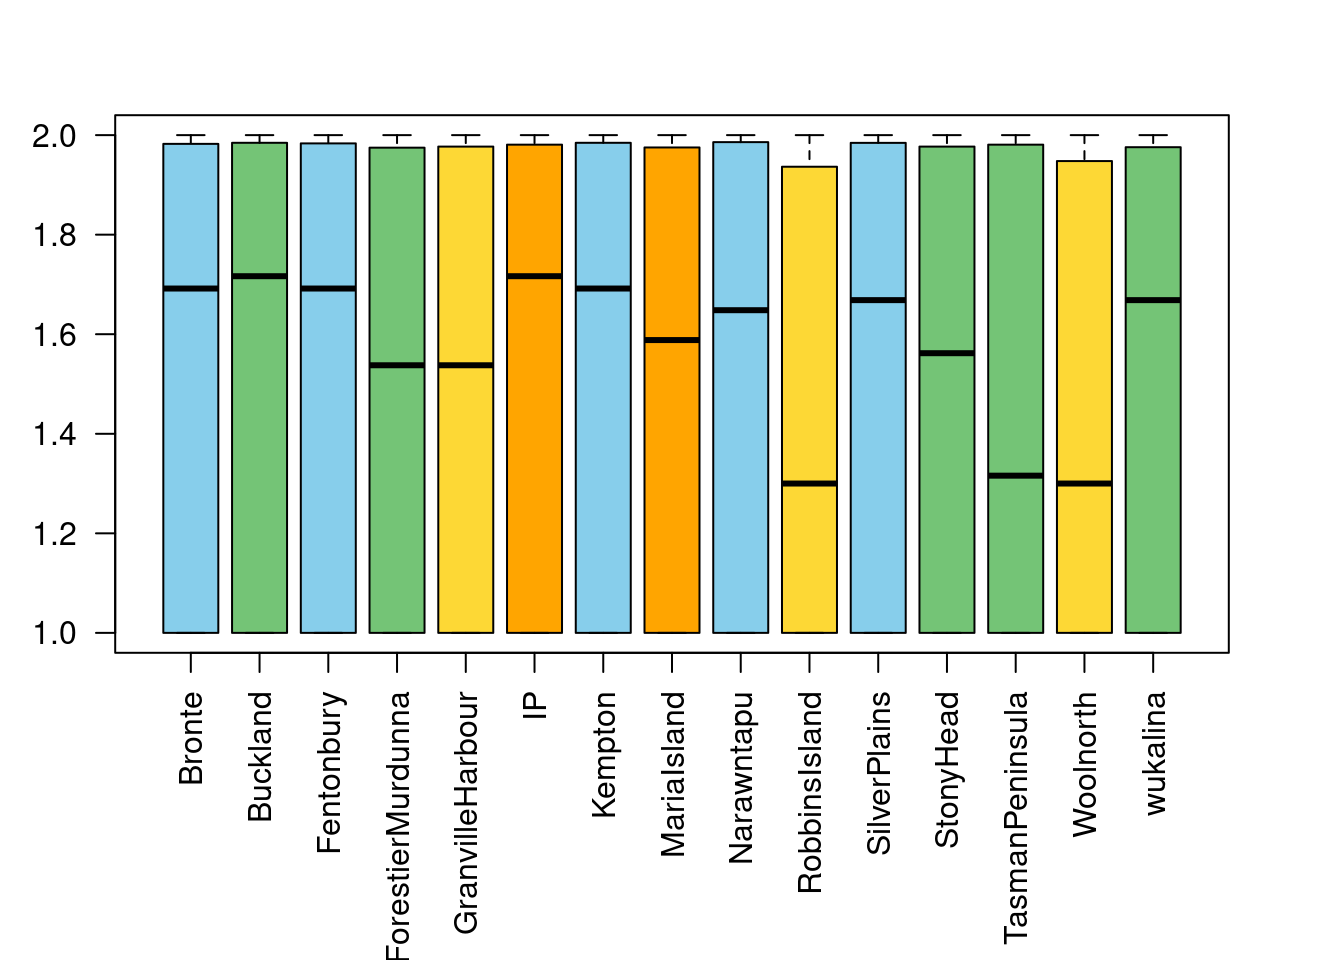
#order boxplot to group locations by west, central, east, insurance population
ar.ordered <- ar[,c(10, 14, 5, 1, 3, 11, 9, 7, 13, 4, 12, 15, 2, 6, 8)]
tascols.ordered <- tascols[c(10,14,5,1,3,11,9,7,13,4,12,15,2,6,8)]
boxplot(ar.ordered, ylab="Allelic richness", las=2, col=tascols.ordered)
Calculate heterozygosity statistics for each population
The function gl.report.heterozygosity reports the observed, expected, and unbiased heterozygosities and Fis (inbreeding coefficient) by population or the observed heterozygosity for each individual in a genlight object.
Calculate heterozygosity and inbreeding statistics for each population. Note that the plot is ordered by default from lowest to highest heterozygosity.
Questions
- Which populations have the highest and lowest heterozygosity?
- Within a population, do you notice any patterns of observed compared to expected heterozygosity from the graph?
- What about Fis?
#use the ? to search the help for a function and see what options can be specified
#?gl.report.heterozygosity
hets <- gl.report.heterozygosity(gl, method="pop",plot.colors.pop = tascols)
Starting gl.report.heterozygosity
Processing genlight object with SNP data
Calculating Observed Heterozygosities, averaged across
loci, for each population
Calculating Expected Heterozygosities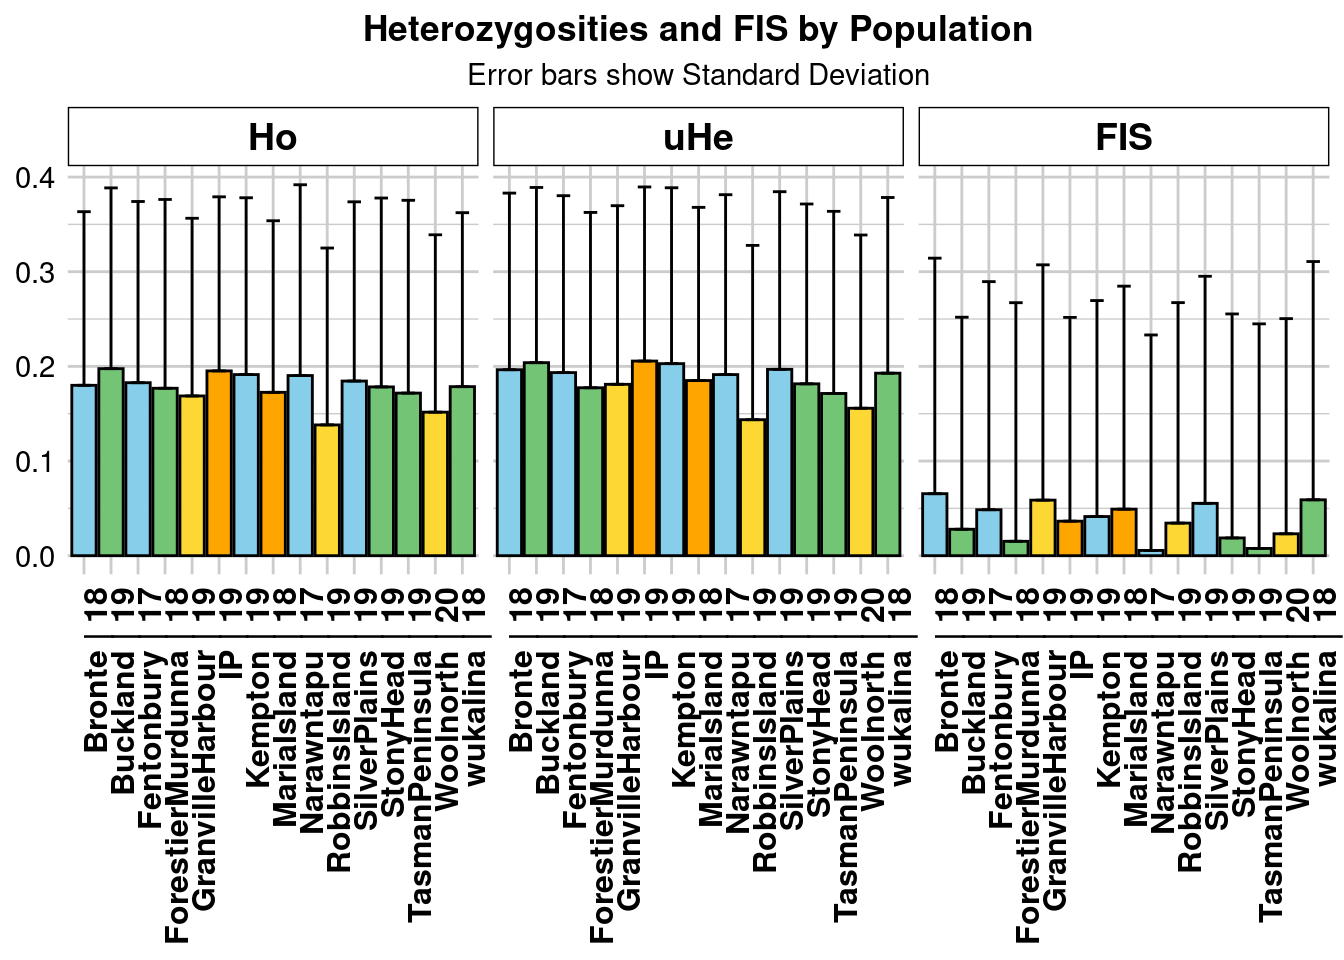
                                pop    n.Ind n.Loc n.Loc.adj polyLoc monoLoc
Bronte                       Bronte 18.02285  1663         1    1178     485
Buckland                   Buckland 18.71257  1663         1    1192     471
Fentonbury               Fentonbury 17.15394  1663         1    1131     532
ForestierMurdunna ForestierMurdunna 18.42694  1663         1    1050     613
GranvilleHarbour   GranvilleHarbour 18.59952  1663         1    1058     605
IP                               IP 19.15695  1663         1    1239     424
Kempton                     Kempton 19.31209  1663         1    1215     448
MariaIsland             MariaIsland 18.28322  1663         1    1151     512
Narawntapu               Narawntapu 17.49008  1663         1    1108     555
RobbinsIsland         RobbinsIsland 19.25376  1663         1     858     805
SilverPlains           SilverPlains 18.55081  1663         1    1160     503
StonyHead                 StonyHead 18.78593  1663         1    1042     621
TasmanPeninsula     TasmanPeninsula 19.17739  1663         1     962     701
Woolnorth                 Woolnorth 19.57547  1663         1     935     728
wukalina                   wukalina 18.34275  1663         1    1160     503
                  all_NALoc       Ho     HoSD     HoSE HoLCI HoHCI   Ho.adj
Bronte                    0 0.179996 0.183418 0.004498    NA    NA 0.179996
Buckland                  0 0.197586 0.190966 0.004683    NA    NA 0.197586
Fentonbury                0 0.182757 0.191409 0.004694    NA    NA 0.182757
ForestierMurdunna         0 0.176872 0.199446 0.004891    NA    NA 0.176872
GranvilleHarbour          0 0.168749 0.187710 0.004603    NA    NA 0.168749
IP                        0 0.195225 0.183868 0.004509    NA    NA 0.195225
Kempton                   0 0.191338 0.186795 0.004581    NA    NA 0.191338
MariaIsland               0 0.172589 0.181246 0.004444    NA    NA 0.172589
Narawntapu                0 0.190309 0.201556 0.004943    NA    NA 0.190309
RobbinsIsland             0 0.138154 0.186892 0.004583    NA    NA 0.138154
SilverPlains              0 0.184496 0.189312 0.004642    NA    NA 0.184496
StonyHead                 0 0.178307 0.199528 0.004893    NA    NA 0.178307
TasmanPeninsula           0 0.171776 0.203659 0.004994    NA    NA 0.171776
Woolnorth                 0 0.151634 0.187370 0.004595    NA    NA 0.151634
wukalina                  0 0.178577 0.183757 0.004506    NA    NA 0.178577
                  Ho.adjSD Ho.adjSE Ho.adjLCI Ho.adjHCI       He     HeSD
Bronte            0.183418 0.004498        NA        NA 0.191019 0.181399
Buckland          0.190966 0.004683        NA        NA 0.198461 0.180158
Fentonbury        0.191409 0.004694        NA        NA 0.187777 0.181461
ForestierMurdunna 0.199446 0.004891        NA        NA 0.172591 0.180186
GranvilleHarbour  0.187710 0.004603        NA        NA 0.176181 0.183623
IP                0.183868 0.004509        NA        NA 0.200251 0.179103
Kempton           0.186795 0.004581        NA        NA 0.197628 0.181002
MariaIsland       0.181246 0.004444        NA        NA 0.179993 0.177912
Narawntapu        0.201556 0.004943        NA        NA 0.185845 0.184629
RobbinsIsland     0.186892 0.004583        NA        NA 0.139935 0.179352
SilverPlains      0.189312 0.004642        NA        NA 0.191562 0.182624
StonyHead         0.199528 0.004893        NA        NA 0.176730 0.184918
TasmanPeninsula   0.203659 0.004994        NA        NA 0.166905 0.187410
Woolnorth         0.187370 0.004595        NA        NA 0.151784 0.178359
wukalina          0.183757 0.004506        NA        NA 0.187558 0.180554
                      HeSE HeLCI HeHCI      uHe    uHeSD    uHeSE uHeLCI uHeHCI
Bronte            0.004448    NA    NA 0.196470 0.186575 0.004575     NA     NA
Buckland          0.004418    NA    NA 0.203909 0.185104 0.004539     NA     NA
Fentonbury        0.004450    NA    NA 0.193414 0.186909 0.004583     NA     NA
ForestierMurdunna 0.004418    NA    NA 0.177405 0.185211 0.004542     NA     NA
GranvilleHarbour  0.004503    NA    NA 0.181048 0.188696 0.004627     NA     NA
IP                0.004392    NA    NA 0.205617 0.183903 0.004510     NA     NA
Kempton           0.004439    NA    NA 0.202880 0.185813 0.004556     NA     NA
MariaIsland       0.004363    NA    NA 0.185054 0.182914 0.004485     NA     NA
Narawntapu        0.004527    NA    NA 0.191314 0.190062 0.004661     NA     NA
RobbinsIsland     0.004398    NA    NA 0.143666 0.184133 0.004515     NA     NA
SilverPlains      0.004478    NA    NA 0.196868 0.187683 0.004602     NA     NA
StonyHead         0.004535    NA    NA 0.181563 0.189975 0.004659     NA     NA
TasmanPeninsula   0.004596    NA    NA 0.171373 0.192427 0.004719     NA     NA
Woolnorth         0.004374    NA    NA 0.155763 0.183034 0.004488     NA     NA
wukalina          0.004428    NA    NA 0.192814 0.185614 0.004552     NA     NA
                    He.adj He.adjSD He.adjSE He.adjLCI He.adjHCI      FIS
Bronte            0.191019 0.181399 0.004448        NA        NA 0.065498
Buckland          0.198461 0.180158 0.004418        NA        NA 0.027938
Fentonbury        0.187777 0.181461 0.004450        NA        NA 0.048542
ForestierMurdunna 0.172591 0.180186 0.004418        NA        NA 0.015203
GranvilleHarbour  0.176181 0.183623 0.004503        NA        NA 0.058696
IP                0.200251 0.179103 0.004392        NA        NA 0.036454
Kempton           0.197628 0.181002 0.004439        NA        NA 0.041341
MariaIsland       0.179993 0.177912 0.004363        NA        NA 0.049162
Narawntapu        0.185845 0.184629 0.004527        NA        NA 0.005557
RobbinsIsland     0.139935 0.179352 0.004398        NA        NA 0.034448
SilverPlains      0.191562 0.182624 0.004478        NA        NA 0.055302
StonyHead         0.176730 0.184918 0.004535        NA        NA 0.018753
TasmanPeninsula   0.166905 0.187410 0.004596        NA        NA 0.007672
Woolnorth         0.151784 0.178359 0.004374        NA        NA 0.023129
wukalina          0.187558 0.180554 0.004428        NA        NA 0.059040
                     FISSD    FISSE FISLCI FISHCI
Bronte            0.248832 0.006102     NA     NA
Buckland          0.223972 0.005492     NA     NA
Fentonbury        0.241005 0.005910     NA     NA
ForestierMurdunna 0.252059 0.006181     NA     NA
GranvilleHarbour  0.248559 0.006095     NA     NA
IP                0.215288 0.005279     NA     NA
Kempton           0.228187 0.005596     NA     NA
MariaIsland       0.235558 0.005776     NA     NA
Narawntapu        0.227638 0.005582     NA     NA
RobbinsIsland     0.232899 0.005711     NA     NA
SilverPlains      0.239884 0.005882     NA     NA
StonyHead         0.236655 0.005803     NA     NA
TasmanPeninsula   0.237243 0.005818     NA     NA
Woolnorth         0.227312 0.005574     NA     NA
wukalina          0.251719 0.006173     NA     NA
Completed: gl.report.heterozygosity
We can use the same function, but switch the method from “pop” to “ind” to calculate individual-level observed heterozygosity. This can be useful if you are investigating invidiual-level diversity, and may also be useful in assessing the impact of sample quality and missing data on your results.
Question
- What are some possible explanations for outliers with low individual observed heterozygosity?
ind.hets <- gl.report.heterozygosity(gl, method="ind")Starting gl.report.heterozygosity
Processing genlight object with SNP data
Calculating observed heterozygosity for individuals
Note: No adjustment for invariant loci (n.invariant set to 0)
Starting gl.colors
Selected color type 2
Completed: gl.colors 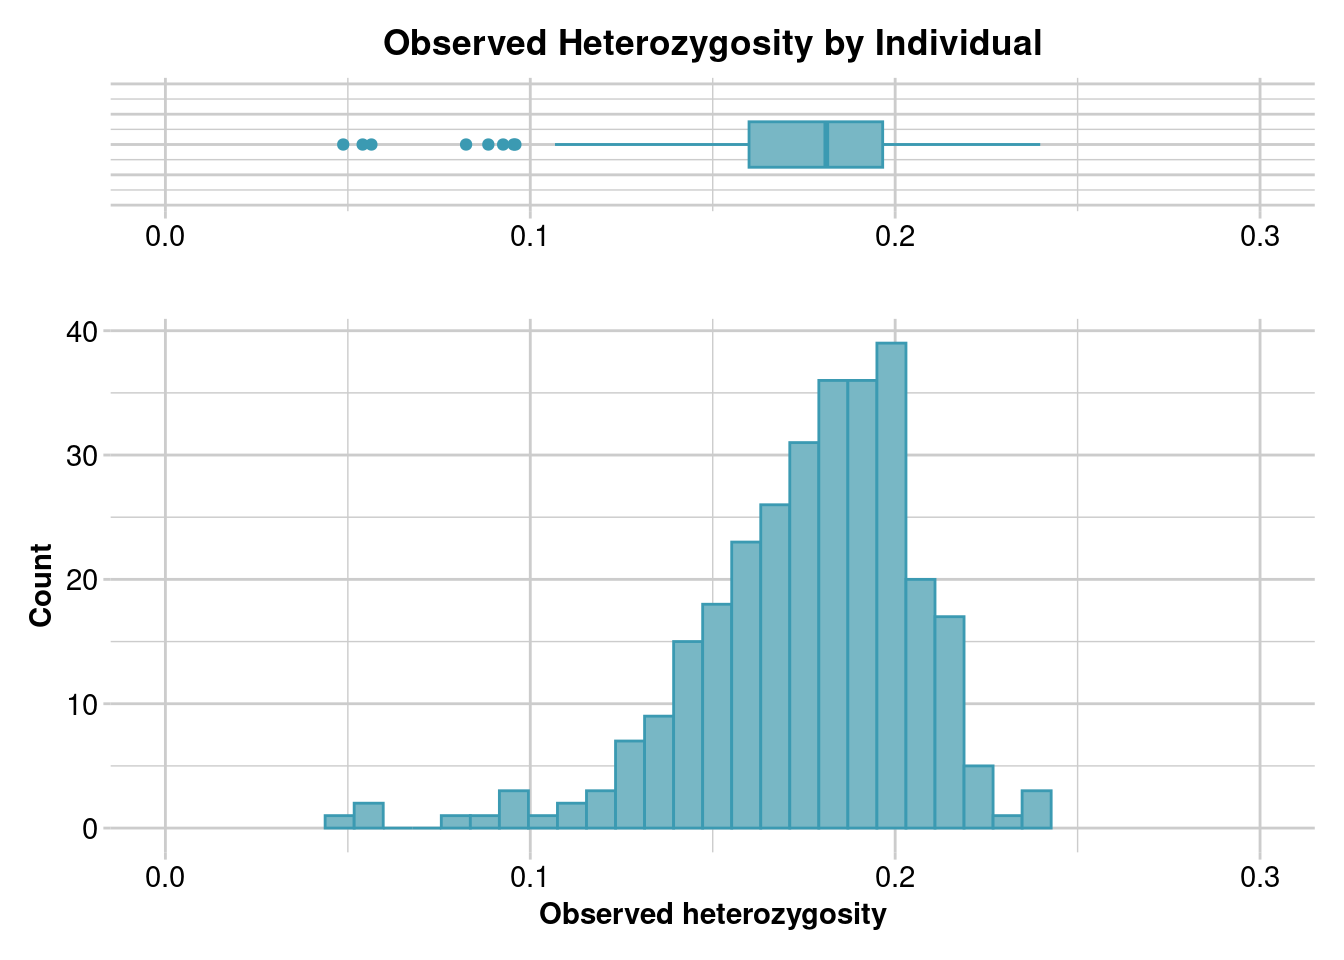
               ind.name         Ho  f.hom.ref f.hom.alt
  F_ForestierMurdunna_4 0.17416830 0.00000000 0.8258317
  M_ForestierMurdunna_5 0.19986720 0.03984064 0.7602922
  M_ForestierMurdunna_2 0.12183436 0.07323751 0.8049281
  F_ForestierMurdunna_8 0.15145228 0.06431535 0.7842324
  M_ForestierMurdunna_4 0.20176630 0.04211957 0.7561141
  F_ForestierMurdunna_1 0.21088435 0.03945578 0.7496599
  F_ForestierMurdunna_6 0.13034623 0.06992532 0.7997284
  M_ForestierMurdunna_7 0.18199737 0.04664915 0.7713535
  F_ForestierMurdunna_7 0.15210140 0.06470981 0.7831888
       M_MariaIsland_10 0.13666667 0.06466667 0.7986667
  F_ForestierMurdunna_5 0.17647059 0.04464918 0.7788802
  M_ForestierMurdunna_3 0.15633423 0.05997305 0.7836927
      F_MariaIsland_101 0.20630019 0.04570723 0.7479926
        M_MariaIsland_1 0.21591610 0.05120296 0.7328809
      M_MariaIsland_102 0.19385194 0.04893350 0.7572146
      M_MariaIsland_101 0.18607595 0.06139241 0.7525316
      M_MariaIsland_103 0.17841270 0.06476190 0.7568254
          U_Buckland_10 0.22365196 0.05392157 0.7224265
          U_Buckland_12 0.21782178 0.05693069 0.7252475
          U_Buckland_14 0.21113831 0.05936353 0.7294982
          U_Buckland_15 0.20519159 0.06427689 0.7305315
          U_Buckland_16 0.14285714 0.10518053 0.7519623
          U_Buckland_18 0.21723077 0.05107692 0.7316923
          U_Buckland_19 0.21568627 0.04289216 0.7414216
  F_ForestierMurdunna_3 0.18404118 0.04633205 0.7696268
                F_IP_10 0.16167665 0.06719894 0.7711244
  M_ForestierMurdunna_1 0.18642993 0.04375396 0.7698161
  M_ForestierMurdunna_6 0.17256637 0.06005057 0.7673831
  M_ForestierMurdunna_8 0.15786040 0.05936073 0.7827789
                 M_IP_1 0.19079755 0.06196319 0.7472393
      M_MariaIsland_100 0.15374593 0.06905537 0.7771987
      M_MariaIsland_104 0.17524510 0.06372549 0.7610294
          U_Woolnorth_1 0.15837937 0.07612032 0.7655003
          U_Woolnorth_2 0.17460317 0.05433455 0.7710623
          U_Woolnorth_3 0.13292308 0.07876923 0.7883077
          U_Woolnorth_4 0.14769231 0.08492308 0.7673846
          U_Woolnorth_5 0.14628150 0.06945298 0.7842655
         U_Woolnorth_10 0.14972274 0.06962415 0.7806531
         U_Woolnorth_11 0.16002491 0.06911582 0.7708593
         U_Woolnorth_12 0.16469857 0.07147296 0.7638285
         U_Woolnorth_13 0.15136476 0.06513648 0.7834988
         U_Woolnorth_14 0.16594695 0.07896360 0.7550895
         U_Woolnorth_15 0.16717886 0.07621389 0.7566073
         U_Woolnorth_16 0.15040398 0.08390305 0.7656930
         U_Woolnorth_17 0.16717886 0.06637984 0.7664413
  U_ForestierMurdunna_1 0.19389027 0.06795511 0.7381546
    U_TasmanPeninsula_1 0.17458359 0.06539173 0.7600247
    U_TasmanPeninsula_2 0.20858896 0.04846626 0.7429448
    U_TasmanPeninsula_3 0.16369231 0.05292308 0.7833846
    U_TasmanPeninsula_4 0.14108142 0.07520199 0.7837166
    U_TasmanPeninsula_5 0.20000000 0.04135802 0.7586420
    U_TasmanPeninsula_6 0.18164910 0.05021699 0.7681339
    U_TasmanPeninsula_7 0.17650677 0.05473555 0.7687577
   U_TasmanPeninsula_10 0.09591584 0.09467822 0.8094059
   U_TasmanPeninsula_11 0.18734491 0.05210918 0.7605459
               M_IP_101 0.19631902 0.06012270 0.7435583
               M_IP_100 0.19159456 0.06613103 0.7422744
               F_IP_104 0.21136225 0.04276115 0.7458766
               F_IP_106 0.23870574 0.05067155 0.7106227
               M_IP_107 0.22167183 0.05077399 0.7275542
               F_IP_100 0.20158343 0.05846529 0.7399513
               M_IP_105 0.21340713 0.05535055 0.7312423
               F_IP_102 0.20599022 0.06662592 0.7273839
               F_IP_103 0.20689655 0.06958128 0.7235222
               M_IP_102 0.23967961 0.05237215 0.7079482
               M_IP_103 0.16656461 0.06674832 0.7666871
               F_IP_101 0.18571429 0.05652174 0.7577640
               F_IP_105 0.19975490 0.06004902 0.7401961
               F_IP_107 0.19378428 0.05362584 0.7525899
               M_IP_106 0.19531731 0.06592730 0.7387554
               M_IP_104 0.19583843 0.06854345 0.7356181
        F_Narawntapu_11 0.18839676 0.06550218 0.7461011
        F_Narawntapu_12 0.21589487 0.05193992 0.7321652
        F_Narawntapu_13 0.20415879 0.05040958 0.7454316
        F_Narawntapu_15 0.20000000 0.07586207 0.7241379
        F_Narawntapu_16 0.20312500 0.05750000 0.7393750
        F_Narawntapu_17 0.19328264 0.05830165 0.7484157
        F_Narawntapu_18 0.18730554 0.04729309 0.7654014
      F_RobbinsIsland_3 0.12991128 0.07287706 0.7972117
      F_RobbinsIsland_6 0.13215859 0.08999371 0.7778477
        M_Narawntapu_12 0.21695130 0.04996837 0.7330803
        M_Narawntapu_13 0.19397363 0.04770873 0.7583176
        M_Narawntapu_14 0.17553957 0.05611511 0.7683453
      M_RobbinsIsland_1 0.14038343 0.08225108 0.7773655
      M_RobbinsIsland_2 0.14860681 0.07244582 0.7789474
      M_RobbinsIsland_4 0.13000000 0.08125000 0.7887500
      M_RobbinsIsland_7 0.12083333 0.07777778 0.8013889
      M_RobbinsIsland_8 0.14285714 0.08208020 0.7750627
      M_RobbinsIsland_9 0.15166461 0.08508015 0.7632552
     M_RobbinsIsland_10 0.09255242 0.11424440 0.7932032
     M_RobbinsIsland_11 0.11124845 0.09332509 0.7954265
     M_RobbinsIsland_12 0.14996849 0.08002520 0.7700063
      F_MariaIsland_102 0.19093851 0.05048544 0.7585761
      F_MariaIsland_103 0.18941868 0.05094709 0.7596342
      F_MariaIsland_105 0.05405405 0.11261261 0.8333333
           M_wukalina_1 0.15709091 0.06545455 0.7774545
         F_StonyHead_18 0.16919026 0.05266623 0.7781435
          F_wukalina_17 0.18232429 0.04592902 0.7717467
           F_Buckland_1 0.18911375 0.05512910 0.7557572
           F_Buckland_2 0.18321119 0.05729514 0.7594937
           F_Buckland_4 0.19346405 0.05228758 0.7542484
           F_Buckland_5 0.21354167 0.04036458 0.7460938
           M_Buckland_1 0.19486504 0.04871626 0.7564187
         M_StonyHead_10 0.15522985 0.07195203 0.7728181
         M_StonyHead_17 0.16979866 0.05906040 0.7711409
         M_StonyHead_18 0.19462228 0.05121639 0.7541613
          M_wukalina_14 0.17203608 0.07216495 0.7557990
           M_Buckland_2 0.19281915 0.04055851 0.7666223
           M_Buckland_3 0.17529331 0.05452036 0.7701863
         F_Fentonbury_3 0.21660182 0.05317769 0.7302205
         F_Fentonbury_4 0.17603250 0.06364252 0.7603250
         F_Fentonbury_6 0.22122762 0.05179028 0.7269821
        F_Fentonbury_10 0.18110236 0.07152231 0.7473753
        F_Fentonbury_14 0.19901547 0.04641350 0.7545710
        F_Fentonbury_15 0.18444730 0.06876607 0.7467866
        F_Fentonbury_16 0.15643713 0.07934132 0.7642216
        F_Fentonbury_18 0.22006472 0.04854369 0.7313916
        F_Fentonbury_19 0.16122715 0.07702350 0.7617493
        F_Fentonbury_21 0.18402556 0.06964856 0.7463259
         M_Fentonbury_1 0.05645161 0.14314516 0.8004032
         M_Fentonbury_2 0.16357388 0.06185567 0.7745704
         M_Fentonbury_5 0.14184953 0.08542320 0.7727273
         M_Fentonbury_8 0.18750000 0.06119792 0.7513021
         M_Fentonbury_9 0.19763092 0.05673317 0.7456359
        M_Fentonbury_10 0.20195440 0.05602606 0.7420195
        M_Fentonbury_11 0.20616570 0.05716121 0.7366731
        M_Fentonbury_12 0.18990890 0.06377015 0.7463210
        M_Fentonbury_13 0.19751472 0.06213211 0.7403532
        M_Fentonbury_14 0.10676835 0.10867493 0.7845567
        M_Narawntapu_16 0.14798206 0.04708520 0.8049327
        M_Narawntapu_17 0.16179775 0.05842697 0.7797753
        M_Narawntapu_18 0.17898194 0.05911330 0.7619048
   U_TasmanPeninsula_13 0.21032505 0.05863607 0.7310389
      F_MariaIsland_106 0.13262999 0.08590806 0.7814619
                M_IP_10 0.10912191 0.12190963 0.7689685
    M_TasmanPeninsula_1 0.17071651 0.06417445 0.7651090
    M_TasmanPeninsula_2 0.15580385 0.05772812 0.7864680
    M_TasmanPeninsula_3 0.20261845 0.04114713 0.7562344
    F_TasmanPeninsula_1 0.16666667 0.05555556 0.7777778
    F_TasmanPeninsula_2 0.17814277 0.04927353 0.7725837
    F_TasmanPeninsula_3 0.16781465 0.07388854 0.7582968
    M_TasmanPeninsula_5 0.19569231 0.05292308 0.7513846
           F_wukalina_1 0.19888129 0.05717837 0.7439403
          F_wukalina_10 0.17635659 0.05167959 0.7719638
          F_wukalina_11 0.22107969 0.03856041 0.7403599
          F_wukalina_12 0.17354839 0.06322581 0.7632258
          F_wukalina_13 0.20093771 0.03482920 0.7642331
          F_wukalina_14 0.13440111 0.09401114 0.7715877
          F_wukalina_15 0.18163934 0.05377049 0.7645902
          F_wukalina_16 0.20420624 0.05698779 0.7388060
    M_TasmanPeninsula_4 0.14019851 0.07133995 0.7884615
    M_TasmanPeninsula_6 0.15613148 0.06826802 0.7756005
          M_wukalina_10 0.19530755 0.05136335 0.7533291
          M_wukalina_11 0.16431925 0.07712944 0.7585513
          M_wukalina_12 0.19670051 0.05647208 0.7468274
          M_wukalina_13 0.17337662 0.07337662 0.7532468
          M_wukalina_15 0.18699690 0.06439628 0.7486068
          M_wukalina_16 0.16923077 0.06666667 0.7641026
          M_wukalina_18 0.15352408 0.07676204 0.7697139
          F_StonyHead_1 0.17728707 0.06750789 0.7552050
             F_Bronte_1 0.18263091 0.06577267 0.7515964
             F_Bronte_2 0.17739899 0.05429293 0.7683081
             F_Bronte_3 0.19204043 0.05748579 0.7504738
             F_Bronte_4 0.16467463 0.06308101 0.7722444
             F_Bronte_5 0.18637771 0.07368421 0.7399381
             F_Bronte_6 0.18204489 0.06172070 0.7562344
             F_Bronte_7 0.04873294 0.11890838 0.8323587
             F_Bronte_8 0.20313480 0.06645768 0.7304075
             F_Bronte_9 0.19195046 0.05510836 0.7529412
         F_StonyHead_12 0.17323327 0.06253909 0.7642276
            F_Bronte_10 0.08850458 0.12512716 0.7863683
            F_Bronte_11 0.17531646 0.06898734 0.7556962
            F_Kempton_1 0.19667944 0.04725415 0.7560664
            F_Kempton_3 0.17910448 0.04228856 0.7786070
          F_wukalina_18 0.17916925 0.05703658 0.7637942
            F_Kempton_6 0.18659987 0.05322480 0.7601753
            F_Kempton_7 0.17816813 0.05959849 0.7622334
            M_Kempton_1 0.19900806 0.05269684 0.7482951
            M_Kempton_2 0.21725636 0.05586592 0.7268777
             M_Bronte_1 0.19739292 0.06579764 0.7368094
             M_Bronte_2 0.20625000 0.06625000 0.7275000
             M_Bronte_3 0.19228376 0.07093964 0.7367766
             M_Bronte_4 0.21777222 0.05944931 0.7227785
             M_Bronte_5 0.19901112 0.05871446 0.7422744
             M_Bronte_6 0.20917085 0.06155779 0.7292714
             M_Bronte_7 0.21036205 0.05617978 0.7334582
             M_Bronte_8 0.08240223 0.11033520 0.8072626
             M_Bronte_9 0.17920918 0.06058673 0.7602041
         M_StonyHead_13 0.16434893 0.06131479 0.7743363
         M_StonyHead_14 0.19003115 0.05358255 0.7563863
         M_StonyHead_15 0.15590346 0.07762557 0.7664710
            M_Kempton_3 0.17402769 0.06526038 0.7607119
            M_Kempton_5 0.20838548 0.05819775 0.7334168
           M_Kempton_12 0.22919255 0.06956522 0.7012422
           M_Kempton_13 0.19394330 0.06185567 0.7442010
          M_wukalina_17 0.18134715 0.06217617 0.7564767
       F_SilverPlains_1 0.16456536 0.06967485 0.7657598
       F_SilverPlains_2 0.19383260 0.05475142 0.7514160
      F_MariaIsland_107 0.19335142 0.05630936 0.7503392
       F_SilverPlains_3 0.21055980 0.05597964 0.7334606
       F_SilverPlains_4 0.18227848 0.06012658 0.7575949
       F_SilverPlains_5 0.19872204 0.05942492 0.7418530
       F_SilverPlains_6 0.18431635 0.05630027 0.7593834
       F_SilverPlains_7 0.14950635 0.07968970 0.7708039
       F_SilverPlains_8 0.18705958 0.05957719 0.7533632
       F_SilverPlains_9 0.19177215 0.06455696 0.7436709
      F_SilverPlains_10 0.16237482 0.06938484 0.7682403
      F_SilverPlains_11 0.23975155 0.04285714 0.7173913
      F_SilverPlains_12 0.20200753 0.06273526 0.7352572
       M_SilverPlains_1 0.18847840 0.06261741 0.7489042
       M_SilverPlains_2 0.16106443 0.07983193 0.7591036
       M_SilverPlains_3 0.20353982 0.06131479 0.7351454
       M_SilverPlains_4 0.17245817 0.08108108 0.7464607
       M_SilverPlains_5 0.14236824 0.09445585 0.7631759
       M_SilverPlains_6 0.18292683 0.05969191 0.7573813
       M_SilverPlains_7 0.19748428 0.06729560 0.7352201
       M_SilverPlains_8 0.19764560 0.07001239 0.7323420
          M_Woolnorth_3 0.15009265 0.06547251 0.7844348
  F_GranvilleHarbour_10 0.20335700 0.05616527 0.7404777
  F_GranvilleHarbour_11 0.16181449 0.07109005 0.7670955
  F_GranvilleHarbour_12 0.18520860 0.05941846 0.7553729
  F_GranvilleHarbour_13 0.15682415 0.06824147 0.7749344
  F_GranvilleHarbour_14 0.14406230 0.07852044 0.7774173
  F_GranvilleHarbour_15 0.20038660 0.07087629 0.7287371
  F_GranvilleHarbour_16 0.09542484 0.09215686 0.8124183
  F_GranvilleHarbour_17 0.19530755 0.05960685 0.7450856
  F_GranvilleHarbour_18 0.17394095 0.06482670 0.7612323
         F_Narawntapu_1 0.19973280 0.03540414 0.7648631
         F_StonyHead_10 0.16871364 0.06528765 0.7659987
         F_StonyHead_11 0.17965229 0.05280103 0.7675467
         F_StonyHead_13 0.19610390 0.06168831 0.7422078
         F_StonyHead_14 0.18045603 0.04039088 0.7791531
        F_Narawntapu_10 0.20251489 0.06353408 0.7339510
  M_GranvilleHarbour_10 0.17857143 0.06265664 0.7587719
  M_GranvilleHarbour_11 0.16869788 0.07119949 0.7601026
  M_GranvilleHarbour_12 0.19038462 0.06410256 0.7455128
  M_GranvilleHarbour_13 0.17773561 0.06325111 0.7590133
  M_GranvilleHarbour_14 0.17289424 0.07093097 0.7561748
  M_GranvilleHarbour_15 0.16987179 0.06602564 0.7641026
  M_GranvilleHarbour_16 0.16519973 0.07582938 0.7589709
  M_GranvilleHarbour_17 0.17517241 0.06620690 0.7586207
  M_GranvilleHarbour_18 0.16502947 0.06417813 0.7707924
         M_StonyHead_12 0.18063678 0.06692658 0.7524366
         M_StonyHead_16 0.18981772 0.05468259 0.7554997
        M_Narawntapu_11 0.13982180 0.07128170 0.7888965
        F_MariaIsland_1 0.18115942 0.06280193 0.7560386
       F_MariaIsland_10 0.15974026 0.06038961 0.7798701
  F_ForestierMurdunna_9 0.18822101 0.05585914 0.7559199
   F_GranvilleHarbour_1 0.19661222 0.06896552 0.7344223
      F_MariaIsland_104 0.16053922 0.07352941 0.7659314
          F_Woolnorth_1 0.14207981 0.07557437 0.7823458
         F_StonyHead_16 0.18359853 0.04957160 0.7668299
         F_StonyHead_17 0.17675378 0.04470426 0.7785420
            F_Kempton_2 0.19413919 0.06593407 0.7399267
            F_Kempton_4 0.18328173 0.07058824 0.7461300
          F_Woolnorth_3 0.14459295 0.07594168 0.7794654
          F_Woolnorth_4 0.12719564 0.09085403 0.7819503
           F_Buckland_3 0.18329177 0.06172070 0.7549875
      F_RobbinsIsland_1 0.15333333 0.07272727 0.7739394
      F_RobbinsIsland_2 0.13534743 0.07794562 0.7867069
      F_RobbinsIsland_4 0.13677812 0.07963526 0.7835866
      F_RobbinsIsland_5 0.14905315 0.07452657 0.7764203
      F_RobbinsIsland_7 0.12484700 0.08935129 0.7858017
      F_RobbinsIsland_8 0.14070048 0.08454106 0.7747585
  M_ForestierMurdunna_9 0.18574109 0.05565979 0.7585991
      M_MariaIsland_105 0.15175333 0.07496977 0.7732769
      M_MariaIsland_106 0.16080097 0.06250000 0.7766990
      M_MariaIsland_107 0.15932408 0.06578153 0.7748944
          M_Woolnorth_1 0.16266174 0.06284658 0.7744917
   M_GranvilleHarbour_1 0.12008005 0.09939960 0.7805203
          M_StonyHead_1 0.16180049 0.06021898 0.7779805
         M_StonyHead_11 0.18661756 0.05524862 0.7581338
            M_Kempton_4 0.16919345 0.06791995 0.7628866
            M_Kempton_6 0.15271266 0.08037508 0.7669123
            M_Kempton_7 0.18624467 0.06634206 0.7474133
            M_Kempton_8 0.19657073 0.07103491 0.7323944
           M_Kempton_10 0.19660194 0.07099515 0.7324029
           M_Kempton_11 0.20255474 0.06690998 0.7305353
           M_Kempton_14 0.19547954 0.07697007 0.7275504
          M_Woolnorth_2 0.12515115 0.09854897 0.7762999
        M_Narawntapu_15 0.19236527 0.05988024 0.7477545
        M_Narawntapu_19 0.16601101 0.07002360 0.7639654
      M_RobbinsIsland_3 0.14062500 0.07625000 0.7831250
      M_RobbinsIsland_5 0.13834951 0.09223301 0.7694175
      M_RobbinsIsland_6 0.16494845 0.06428138 0.7707702
           U_Buckland_1 0.21246973 0.05811138 0.7294189
           U_Buckland_2 0.21372192 0.04918033 0.7370978
          U_Buckland_11 0.13101983 0.09419263 0.7747875
          U_Buckland_13 0.21783981 0.04975728 0.7324029
          U_Buckland_17 0.21173624 0.05686630 0.7313975
   U_TasmanPeninsula_12 0.13308271 0.06390977 0.8030075
  F_ForestierMurdunna_2 0.18864469 0.04761905 0.7637363
 F_ForestierMurdunna_10 0.17819963 0.05756277 0.7642376
         F_StonyHead_15 0.19199500 0.06003752 0.7479675
                 F_IP_1 0.17046980 0.04832215 0.7812081
      F_MariaIsland_100 0.20231566 0.04509445 0.7525899
        F_Narawntapu_14 0.20945946 0.05466830 0.7358722
            F_Kempton_5 0.19515152 0.06727273 0.7375758
          F_Woolnorth_2 0.13934929 0.08901166 0.7716390
        M_Narawntapu_10 0.18390805 0.05747126 0.7586207
Completed: gl.report.heterozygosity
Genetic differentiation by Fst
Calculate pairwise Fsts between populations.
Questions
- Which populations have the largest pairwise Fst value? Where are these populations located?
- Compare the largest Fst value with the PCoA you made earlier. What do you notice?
nclusters <- min(4,parallel::detectCores()) #run with 4 cores if available
#to run faster nboots are set to 100 instead of 1000
#takes about a minute to run
fsts <- gl.fst.pop(gl, nboots=100, percent=95, nclusters = nclusters)
Starting gl.fst.pop
Processing genlight object with SNP data
Completed: gl.fst.pop knitr::kable((round(fsts$Fsts,3)))| ForestierMurdunna | MariaIsland | Buckland | IP | Woolnorth | TasmanPeninsula | Narawntapu | RobbinsIsland | wukalina | StonyHead | Fentonbury | Bronte | Kempton | SilverPlains | GranvilleHarbour | |
|---|---|---|---|---|---|---|---|---|---|---|---|---|---|---|---|
| ForestierMurdunna | NA | NA | NA | NA | NA | NA | NA | NA | NA | NA | NA | NA | NA | NA | NA |
| MariaIsland | 0.135 | NA | NA | NA | NA | NA | NA | NA | NA | NA | NA | NA | NA | NA | NA |
| Buckland | 0.057 | 0.079 | NA | NA | NA | NA | NA | NA | NA | NA | NA | NA | NA | NA | NA |
| IP | 0.104 | 0.023 | 0.057 | NA | NA | NA | NA | NA | NA | NA | NA | NA | NA | NA | NA |
| Woolnorth | 0.237 | 0.055 | 0.174 | 0.077 | NA | NA | NA | NA | NA | NA | NA | NA | NA | NA | NA |
| TasmanPeninsula | 0.052 | 0.163 | 0.083 | 0.134 | 0.264 | NA | NA | NA | NA | NA | NA | NA | NA | NA | NA |
| Narawntapu | 0.086 | 0.086 | 0.039 | 0.062 | 0.181 | 0.117 | NA | NA | NA | NA | NA | NA | NA | NA | NA |
| RobbinsIsland | 0.266 | 0.087 | 0.204 | 0.106 | 0.028 | 0.291 | 0.212 | NA | NA | NA | NA | NA | NA | NA | NA |
| wukalina | 0.051 | 0.086 | 0.032 | 0.069 | 0.180 | 0.082 | 0.065 | 0.215 | NA | NA | NA | NA | NA | NA | NA |
| StonyHead | 0.067 | 0.119 | 0.051 | 0.096 | 0.215 | 0.112 | 0.082 | 0.248 | 0.038 | NA | NA | NA | NA | NA | NA |
| Fentonbury | 0.094 | 0.084 | 0.043 | 0.064 | 0.182 | 0.136 | 0.057 | 0.208 | 0.074 | 0.083 | NA | NA | NA | NA | NA |
| Bronte | 0.099 | 0.076 | 0.036 | 0.056 | 0.171 | 0.130 | 0.052 | 0.202 | 0.070 | 0.081 | 0.035 | NA | NA | NA | NA |
| Kempton | 0.071 | 0.079 | 0.021 | 0.055 | 0.177 | 0.104 | 0.044 | 0.206 | 0.059 | 0.071 | 0.024 | 0.025 | NA | NA | NA |
| SilverPlains | 0.082 | 0.081 | 0.025 | 0.063 | 0.179 | 0.116 | 0.049 | 0.206 | 0.060 | 0.074 | 0.036 | 0.027 | 0.019 | NA | NA |
| GranvilleHarbour | 0.169 | 0.029 | 0.106 | 0.043 | 0.079 | 0.195 | 0.107 | 0.110 | 0.124 | 0.153 | 0.103 | 0.098 | 0.098 | 0.1 | NA |
#summary(fsts$Fsts)Further Study
Farquharson et al. (2022)